Digital & environment : How to evaluate server manufacturing footprint, beyond greenhouse gas emissions?
Today, many organizations depends on data centers. Unfortunately, the environmental impacts of these infrastructures are still quite unknown, particularly the manufacturing phase of the equipments in these data centers. To address these gaps, the Boavizta working group has defined calculation formulas that estimate the environmental footprint of the manufacturing phase of servers, which are the most numerous equipment in data centers. These formulas are the result of a long research work with many iterations. This article proposes to capture and resume this journey.
Introduction
Today, most of the available literature discussing the environmental impact measurement of data centers focuses on the impact of energy consumption. Similarly, most Cloud infrastructure providers who report their carbon footprint do only consider part of the impact they generate: while their direct greenhouse gas (GHG) emissions (Scope 1) and indirect emissions linked to energy consumption (Scope 2) are accounted for, all indirect emissions (Scope 3) are not included, leaving out a wide range of activities, from manufacturing and transportation to the end of life of all data center equipments (servers, networks, air conditioning, alarm systems, buildings).

Yet, the study "Chasing Carbon: The Elusive Environmental Footprint of Computing", produced by researchers from Facebook, Harvard and the University of Arizona (ASU), and published in October 2021, confirms the importance of indirect GHG emissions inherently linked to the manufacturing of digital infrastructure.
Furthermore, authors emphasize that these activities have much broader impacts that can’t be restricted to the GHG indicator alone. Such information reinforced at the same time our interest in searching for multi-criteria approaches to quantify how much these activities do impact the water resources, the extraction of non-renewable natural resources, the biodiversity, etc.
For us at Boavizta, it seemed then natural to try and quantify as broadly as possible the impact of the scope 3 category. Servers being the most representative equipment in a data center, we chose to focus first on this element.
Boavizta is a working group that aims to simplify, make reliable and accelerate the evaluation of the environmental impact of digital organizations. This voluntary initiative federates the actors of the ecosystem (companies, associations, research) and organizes the co-construction of expert and updated resources under free licenses: measurement methodology, data repository, calculation engine, etc.
Starting point: The ADEME carbon database
To begin with, we naturally went looking for public data on the subject. The French Environment and Energy Management Agency (ADEME), offers in its so-called Carbon Database (aka Base Carbone®) the figure of 600 kg of CO2 equivalent (CO2eq) for the server manufacturing. This figure dates back to 2014 with an associated uncertainty factor of 80%. No more details are provided regarding the specifications of the reference equipment.
As the servers have very heterogeneous hardware configurations, this approach did not seem satisfactory enough to obtain a sufficiently precise measurement that would improve the current process.
Two other approaches are mentioned in the 2020 version of the Carbon Database :
- When there is no emission factor available for a particular piece of equipment, the Base Carbone documentation suggests assigning emission values in proportion to the selling price, compared to the price of a personal computer . Thus, a server that is invoiced at 5 times the price of a PC with an emission factor of 189 kgCO2eq is assigned an emission factor of 5*189 = 945 kgCO2eq.
- ADEME also proposes a carbon intensity of 80.7 kgCO2eq/kg for the manufacture of network equipment such as switches, routers and firewalls (which are the closest equipments to the servers within the Carbon Database).
The costs and configurations of personal computers seemed to be much too variable for the monetary ratio approach to be reliable. We will see later that, although the "by weight" approach may seem convenient, it is not suitable for electronic equipment.
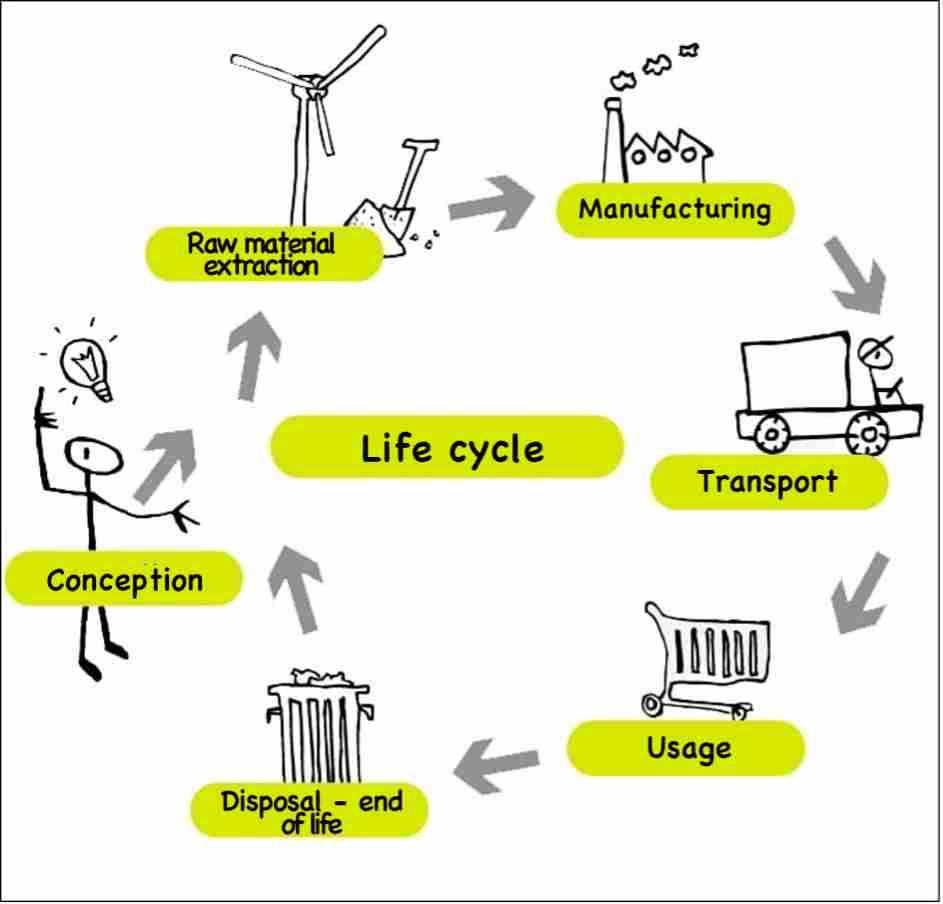
On the manufacturer side, some companies such as Dell, HP and Lenovo have published some datasheets presenting the carbon footprint of their equipments. These datasheets, called PCF for "Product Carbon Footprint" or PEF for "Product Environmental Footprint", allowed us, for the most part, to clearly identify the GHG impacts corresponding to the different stages of the equipment's life cycle (i.e. manufacturing, transport, use and end of life - see the 'LCA' insert below in this article).
Following this first inventory, we decided to collect a maximum of manufacturer data, to parse them and try to deduce a simple calculation formula that estimates the GHG emissions related to the manufacturing, transport, and end of life of a server.
1st iteration: identification of impacting variables and a first formula
1.1 Approach
The sources on which we relied for the most part of this iteration are the following:
The forms, collected in PDF format, are not at all formalized in the same way, so we thought it would be wise to extract the information and centralize it in a spreadsheet-like format to facilitate their use. This dataset is shared publicly on Github.

GHG emissions related to manufacturing are not directly reported in the data sheets. In general, we have a global carbon footprint for the equipment and a percentage associated for each of the life cycle stages. Below is an example for the Dell R740 server:

The impact related to manufacturing is therefore calculated as follows:
- When the manufacturing percentage is available, we apply it to the overall footprint:
servermanufgwp (kgCO2eq) = servertotalgwp (kgCO2eq) x servermanufratio_gwp (%)
In the example of the Dell R740, the PCF sheet gives us a global impact of 8640 kgCO2eq, so we obtain: 8640 x 15.2% = 1313 kgCO2eq for manufacturing
- When only the percentage related to use is available, we approximate the impact of manufacturing as the difference between the overall impact and the impact of use:
servermanufgwp (kgCO2eq) ~= serverscope3gwp (kgCO2eq) = servertotalgwp (kgCO2eq) x ( 1 - serveruseratio_gwp (%) )
We have allowed ourselves this approximation because in all the data sheets consulted, the impact of both transportation and end of life are negligible compared to that of manufacturing.
The first interesting findings emerge when analyzing the manufacturer's data:
- The breakdown between the carbon impact of the manufacture of a server and the impact related to its use is approximately:
- The margins of error displayed by manufacturers on the overall carbon impact (manufacturing, transport, use and end of life) are very high, at almost 100%. This is mainly due to the uncertainties on the usage rate which can vary by more than 500%. But it is also due to the impact of the manufacturing of electronic components on which there can be an uncertainty of up to 100% according to the manufacturers' data.
- We found some inconsistencies in the data provided. In particular, the carbon intensities of the electricity mixes used for Europe and the United States do not seem to be consistent from one sheet to another, even between those produced by the same manufacturer.
These elements will be the structure of the next iteration of our analysis because:
- They confirm the importance of measuring the impact of manufacturing, especially in countries where data centers have acces to low-carbon electricity.
- The margins of error of these data are such that we can afford an iterative approach starting with initial impact estimates that are not very precise. This also makes it acceptable to reason with average ratios (e.g., impact of the manufacture of a piece of equipment in relation to its electricity consumption) rather than making a very precise measurement.
From the collected data, we attempted to establish a formula for estimating the impact of server manufacturing based on the few available variables:
- Height (number of U) - Data available on a part of the PCF sheets only
- Weight in kg
- Server format: Rack, Tower or Blade
- Number of CPUs - note that the model is never specified
- Amount of memory (RAM), expressed in GB - as for the CPUs, the sheets do not provide the specifications (number of DIMMs, etc.)
Without sufficient data on server height, we were unable to analyze this type of correlation, but the analysis performed on machine weight suggests that server height has relatively little to no influence on the overall impact of hardware manufacturing.
IAs a matter of fact, a simple division of the carbon impact of the manufacturing of a server by its weight gives results ranging from 17kgCO2eq/kg to 564kgCO2eq/kg with an extremely high variance. We have therefore dismissed this variable in our formula.
On the other hand, we noticed that the server type had an influence: with the same amount of RAM and CPU and the same year of manufacture: Blade servers are systematically more impactful (by about 37%) than Rack or Tower servers.
We therefore assume that the miniaturization of servers has a non-negligible impact. This assumption may seem at first to contradict the previous finding that server height has little impact. However, whether it is 1U or 3U in size, a Rack server incorporates the same types of motherboards and daughterboards with the same level of miniaturization, unlike Blade servers which achieve a much higher level of miniaturization.
Next are RAM and CPU, which seem to be the components whose quantity varies the most in the carbon impact of server manufacturing.
1.2 Proposed formula from the PCF sheets
servermanufgwp(kgCO2eq) = servertypegwp(kgCO2eq) + cpuunits(unit) x cpubasegwp(kgCO2eq/unit) + ramsize(GB) x ramsizegwp(kgCO2eq/GB)
Assuming that the impact of manufacturing could be estimated with the following formula above, we started by setting the constants cpubasegwp and ramsizegwp by comparing similar servers with the only difference being the number of CPUs or the amount of RAM. GWP stands for Global Warming Potential.
Then, we established a first formula with an arbitrarily chosen servertypegwp value. We varied the different constants from one to the other, systematically measuring the margin of error associated with the manufacturer's data.Finally, we came up with the formulas below, which gave us a standard deviation of 4%.
For a Rack server :
servermanufgwp(kgCO2eq) = 850(kgCO2eq) + cpuunits(unit) x 150(kgCO2eq/unit) + ramsize(GB) x 3(kgCO2eq/GB)
For a Blade server :
servermanufgwp (kgCO2eq) = 1150(kgCO2eq) + cpuunits (unit) x 150(kgCO2eq/unit) + ramsize (GB) x 3(kgCO2eq/GB)
Note: The formulas were defined based on the sheets published for servers manufactured in 2018 and 2019. New sheets were published after this first iteration.
1.3 Results of this first iteration
We can evaluate the carbon emissions of the manufacturing of a server with:
- The actual impact of the server model when we have the manufacturers' data for it.
- An approximation of the impact depending on the type of server (Rack, Tower or Blade) and the amount of CPU and RAM when the data is not available for a model.
1.4 Limitations of this first iteration
The first limitation of this approach is that it is based exclusively on data provided by the manufacturers. The methodological steps used for the evaluation are not detailed and we were able to find inconsistencies between two sets of these same data. Nevertheless, this information is part of the rare freely available data.
Secondly, the exact configurations (RAM, CPU, storage) of the machines analyzed by the manufacturers are generally not very precise. On some level, the configurations presented are also not very representative of the specifications of the machines actually running in data centers. This is particularly the case when we look at the amount of RAM per CPU core, which is very low in the overall configurations analysed. It is therefore tricky to use this raw information to cross-reference it with an existing IT inventory. The risk is to underestimate the impact if the difference between the real configuration of a server and the one used by the manufacturer to calculate its carbon footprint is not taken into account.
Unfortunately, only Dell, HP and Lenovo do publish this type of data for servers. It must be said that Dell has the merit of having published PCF data sheets for all its server models, unlike HP, which publishes far less, or Lenovo, whose reports are too difficult to use because of the heterogeneity of their formats.
It should also be noted that our analysis remains limited due to the relatively small dataset available to us (about 50 usable PCF records at the time of the study).
Finally, with very few exceptions, these data are focused on the carbon footprint and do not cover the use of other resources, which we very much wanted to be able to consider. This even seemed necessary to avoid this approach since our measurements could lead to pollution transfers. For example, reducing the impact analysis to the sole criterion of GHG emissions could negatively impact another criterion, such as the consumption of water or mining resources.
2nd iteration: definition of arbitrary emission factors per component
In order to go further on our analysis and to increase its accuracy, we went in search of new studies and data allowing us to evaluate the environmental footprint of semiconductor manufacturing. This "component" approach appeared to be an interesting lead after consulting the study "Life-Cycle Assessment of Semiconductors" by Sarah B. Boyd.
In this book, the author states that the carbon emissions associated with the manufacture of high-density electronic components account for the majority of the emissions associated with server manufacturing. However, this study dates back to 2011 and the data regarding the impact of the various components cannot be used as it is today, because the manufacturing process of semiconductors have evolved tremendously since then (32nm lithography in 2011 to 2nm in 2021).
In this second iteration we also relied on several other publications:
- The study "The environmental footprint of logic CMOS technologies" which allows the integration of the environmental component in the DTCO (Design-technology co-optimization) framework used by semiconductor manufacturers. It provides information on the carbon impact of the manufacturing of semiconductors according to the lithography process precision (28 to 2 nm). It also confirms that the carbon impact increases when the engraving size decreases, but that the impact decreases at equal semiconductor capacities (168% increase of the impact when the engraving size is divided by 14).
- The new PCF (Product Carbon Footprint) reports, published by Dell at the beginning of 2021, show a significantly reduced manufacturing impact (around 750kgCO2eq) compared to the 2019 data. However, this reduction in impact must be put into perspective, because the hardware configurations analysed are still not representative of those deployed in data centers as of 2021 (only 8 to 16 GB of RAM per server, for example).
- Dell PowerEdge R740 Life Cycle Assessment (LCA) published in June 2019. As the only true LCA available for a server equipment, this document provides us with information on the impacts according to several criteria (GHG emissions, depletion of abiotic resources, acidification and eutrophication potentials and impact on the ozone layer).
| What is a Life Cycle Assessment ? |
|---|
| According to ADEME, “Life Cycle Assessment (LCA) is the most successful tool for global and multi-criteria evaluation of environmental impacts. This standardized method makes it possible to measure the quantifiable effects of products or services on the environment.” Its main caracteristics are :
|
2.1 Comparison of the Life Cycle Assessment with the Product Carbon Footprint
Based on the identified publications, we made a detailed analysis by component that would allow us to determine:
- if some specific semiconductors are at the origin of the main impact drivers
- emission factors for each of these components
In this area, one of the only relevant and publicly available resources is the LCA performed on the Dell R740 server mentioned above. Here is the detailed manufacturing carbon footprint by component for this machine:
| Parts | Emissions (kgCO2eq) |
|---|---|
| 8*3.84TB Solid State Drives | 3379 |
| 12*32GB DIMMs Memory | 533 |
| Mainboard PWB | 109 |
| 1*400GB Solid State Drive | 64 |
| Riser card 1 - Riser card 2 - Riser card 3 - Ethernet card - HDD Controller - Q-logic - Intel Ethernet X710 | 59 |
| 2*Xeon CPUs with housing | 47 |
| Chassis | 34 |
| PSU | 30 |
| Mainboard Connectors - Transport | 20 |
| Fans | 13 |
| Total | 4288 |
Dell R740 Manufacturing GHG Emissions Breakdown
At first glance, we can see that the eight large-capacity SSDs have a substantial impact. It is worth noting that RAM - at a much more realistic 384GB capacity than in Dell's PCFs - is the second highest manufacturing emissions factor in this analysis.
The study also points out once again the importance of these electronic components:
"The twelve 32GB RAM bars used within the configuration account for around 33% of the total mass of the mixed PWB. But analogous to the mass vs. carbon footprint discussions in chapter 4.2.1, they account for over 90% of the total GWP impact of the PWB Mixed due to their high capacity per RAM bar and the associated complexity and density of the built-in chips and dies."
Dell also published a PCF report on the carbon footprint of the R740. We looked at it to see if the carbon impact matched the LCA data. Since the specifications of the two machines are not identical, we had to adapt a few things about the R740 from the LCA to come up with a comparable configuration:
- Remove the 8 SSDs
- Keep only one 32GB RAM array
- Add some storage drives. The R740 configuration in the PCF report has 2 SSDs and a 1TB 2.5" HDD. So we simply multiplied the manufacturing footprint shown for an SSD by two and added the manufacturing impact of a 1.2TB 2.5" HDD drive manufactured in 2019 (Seagate Exos 10E2400).
Here is a table comparing the manufacturing impact of the two R740 configurations depending on the source:
| R740 Product Carbon Footprint | Emissions | R740 Life Cycle Assessment (adapted) | Emissions |
|---|---|---|---|
| 32 GB Memory | 1 x 32GB DIMM | 44 | |
| 2 x 300GB 2,5” HDD 1 x 1TB 2,5” HDD | 2 x 400GB 2,5” SSD + 1 x 1.2TB 2,5” HDD | 140 | |
| 2 CPUs | 2 x Xeon CPUs with housing | 47 | |
| Other (chassis, PSU, mainboard, cards, etc.) | 265 | ||
| Total | 1313 | Total | 496 |
This result is quite disturbing. While we compared two similar machines using data produced by the same manufacturer, we obtained radically different values: 1313 kgCO2eq for one machine, compared to 496 kgCO2eq for the other, which represents a 45% uncertainty with respect to the average value. This could suggest that these two analyses were not performed with the same methodology and/or using the same emission factors.
If we make the same comparison on configurations with 12 x 32GB RAM instead of one, the absolute difference remains the same (817kgCO2eq) but the level of uncertainty decreases (30%) due to the larger baseline value.
If we compare Dell's SSD manufacturing impact data with data provided by manufacturer Seagate, we find that they are also significantly different (7.52 kgCO2eq for a 1.92TB Seagate Nytro 1551, and 64 kgCO2eq for a 400GB Dell SSD drive in the R740).
2.2 Results of this second approach and formula update
Despite these rather disturbing results, we were still able to draw an important conclusion from this analysis: with the data we have today, we must accept a significant margin of error (30 to 50%) in the measurement of the carbon impact of the manufacture of a server. It therefore seemed acceptable to us to set arbitrary values as we had done in the first iteration.
On this occasion we have updated and enriched the formula introduced previously to better take into account the configurations of the analysed equipment (disks, and GPU cards in addition to CPU and RAM):
For a Rack server:
servermanufgwp(kgCO2eq) = 900(kgCO2eq) + cpuunits(unit) x 100(kgCO2eq/unit) + ramsize(GB) x 150/128(kgCO2eq/GB) + ssdunits(unit) x 100(kgCO2eq/GB) + hddunits(unit) x 50(kgCO2eq/GB) + gpuunits(unit) x 150(kgCO2eq/unit)
For a Blade server:
servermanufgwp(kgCO2eq) = 1100(kgCO2eq) + cpuunits(unit) x 100(kgCO2eq/unit) + ramsize(GB) x 150/128(kgCO2eq/GB) + ssdunits(unit) x 100(kgCO2eq/GB) + hddunits(unit) x 50(kgCO2eq/GB) + gpuunits(unit) x 150(kgCO2eq/unit)
2.3 Limitations of this second approach
This second approach, although more detailed, remains focused on carbon impact and still does not integrate other environmental criteria.
Some of the emission factors remain highly inaccurate. For example, we could not find data on the carbon footprint of modern GPU manufacturing. So, we set an arbitrary value assuming that it would be comparable to that of CPU and RAM manufacturing. But overall, these values are still unsatisfactory, especially because we could only use a single emission factor for a part of the components (CPU, GPU, SSD, HDD).
3rd iteration: towards a multi-criteria impact calculation formula
Sarah Boyd's study used in the previous iteration also shows that the main sources of environmental impacts come from high-density semiconductors. In particular, she highlights several key points:
- the importance of the wafer manufacturing and chip assembly/packaging phases
- the same logic applies for the different types of electronic components: CMOS logic, flash memory and DRAM.
Semiconductors, these basic elements of integrated circuits also called electronic chips or electronic components, are the subject of this third and last iteration. This path seemed to be a good one to follow in order to establish variables allowing to improve the precision of our formula.
3.1 Manufacturing process of electronic components
In order to better understand the existing literature, we have dug into the component manufacturing process. Below is a diagram describing the main stages of the life cycle of a component and the mobilized resources.

Let’s then highlight some terminology definition from the electronic domain (Wikipedia):
- The term wafer is used to describe a very thin slice or substrate of semiconductor material such as crystalline silicon (c-Si). The wafer is then subjected to various techniques such as doping, etching, thin-film deposition of other materials and photolithography to fabricate a chain of microstructures or microcircuits
- The wafer is finally cut to obtain a set of 'die'. The term die refers to the square of silicon containing the microstructures forming an integrated circuit. By extension, die is synonymous with electronic chip.
As described in the Techspot article "What is Chip Binning?", manufacturing a wafer is a complex process that generates a significant environmental impact. These wafers are available in a variety of diameters ranging from 25.4 mm (1 inch) to 300 mm (11.8 inches).

To learn more about the wafer manufacturing process and its environmental impacts, we also recommend consulting the CNRS Ecoinfo website (French).
How to size the die area?
The die area (i.e. the surface of the electronic chip) appears to be an essential piece of information to evaluate the environmental impact of CPU, RAM and SSD components. We had to find a way to estimate this surface from the technical characteristics of the components.
Case of the CPU
To obtain the die area of a CPU, we need to know:
- the underlying microarchitecture and/or the processor "family
- the number of physical cores on the processor, also called cores
Microarchitecture refers to the lithography process used, particularly at the level of precision of engraving during the manufacture of semiconductors. We speak for example of "14 nm" microprocessors.
Each manufacturer produces "families" of processors that are associated with these processes. For each family, it is possible to find the associated die area, notably on WikiChip. To sum-up, here are the main families of processors, the die area and the corresponding maximum number of cores:
| CPU Family | Introduction Year | Process (nm) | Die size (mm2) | Core Number | Size/Core (mm2) |
|---|---|---|---|---|---|
| Skylake | 2017 | 14 | 694 | 28 | 24.8 |
| Skylake | 2017 | 14 | 485 | 18 | 26.9 |
| Skylake | 2017 | 14 | 325 | 10 | 32.5 |
| Coffee Lake | 2017 | 14 | 149 | 6 | 24.8 |
| Coffee Lake | 2017 | 14 | 174 | 8 | 21.8 |
| Broadwell | 2014 | 14 | 456 | 24 | 19.0 |
| Broadwell | 2014 | 14 | 306 | 14 | 21.9 |
| Broadwell | 2014 | 14 | 246 | 10 | 24.6 |
| Haswell | 2013 | 22 | 622 | 18 | 34.6 |
| Ivy Bridge | 2011 | 22 | 160 | 4 | 40.0 |
| Ivy Bridge | 2011 | 22 | 257 | 6 | 42.8 |
| Ivy Bridge | 2011 | 22 | 341 | 10 | 34.1 |
| Ivy Bridge | 2011 | 22 | 541 | 15 | 36.1 |
| Sandy Bridge | 2010 | 32 | 216 | 4 | 54.0 |
We can see that the die/core area evolves with each generation but seems to converge with the 14nm process-based families produced since 2014.
Case of RAM
For RAM (as for SSD), the characteristic to consider when determining the die area of the component is the storage density, i.e. the volume of data that can be processed/stored per die area.
Anandtech provides interesting information on the evolution of this density according to the technologies & architectures used.
In summary:
| Manufacturer | Architecture | GB/cm2 |
|---|---|---|
| Samsung | 30nm | 0.625 |
| Samsung | 25nm | 1.25 |
| Samsung | 20nm | 1.75 |
| Samsung | 18nm | 2.38 |
| SK hynix | 30nm | 0.750 |
| SK hynix | 26nm | 1.00 |
| SK hynix | 21nm | 1.31 |
| SK hynix | 21nm | 1.88 |
| Micron | 30nm | 0.750 |
| Micron | 30nm | 0.875 |
| Micron | 20nm | 1.13 |
| Micron | 20nm | 1.13 |
Case of the SSD
TheMemoryGuy presents a summary of storage densities shared at the International Solid-State Circuits Conference (ISSCC) by leading SSD vendors Toshiba, Samsung and Micron.
In summary:
| Manufacturer | Storage density (GB/cm2) |
|---|---|
| Micron | 49.6 |
| Toshiba | 48.5 |
| Samsung | 53.6 |
3.2 Availability of multi-criteria impact factors
With the importance of multi-criteria impact analyses in mind, we pursued our research and our attention was drawn to the study "Green Cloud Computing" published in 2021 by the German Federal Environment Agency (Umweltbundesamt). This document deals with the environmental impacts of online services: online storage, virtual desktop infrastructure, video streaming and video conferencing.
This study is very interesting for several reasons:
- It proposes a bottom-up approach that allows to understand the impacts from the unit components (including the server components).
- It is a multi-criteria LCA with notably the GWP (Global Warming Potential), PE (Primary Energy) and ADP (Abiotic Depletion Potential) indicators.
- The study is very well documented with a great concern for transparency.
| What are the main environmental indicators considered? |
|---|
| Abiotic Depletion Potential (ADP): assesses the use of fossil minerals and raw materials. The term “abiotic resources” refers to non-living resources such as soil, water, air and minerals. Unit: This indicator is expressed in kg antimony equivalents (kgSbeq). Antimony (symbol Sb) is the chemical element used as a reference unit to quantify raw material consumption in a life cycle assessment. Some studies differentiate between impacts related to mineral resources (ADPe or ADPelement) and those related to fossil resources (ADPf or ADPfossils) |
| Global Warming Potential (GWP): evaluates the effect on global warming. Unit: this indicator is expressed in kilograms of carbon dioxide equivalent (kgCO2eq).. |
| PE (Primary Energy): evaluates energy resources consumption(renewable + non-renewable) Unit: this indicator is expressed in megajoules (MJ) |
In addition to the electronic chips and thus die surfaces, each component integrates other elements that are also taken into account in the study
- for the CPU
- the heat sink (mainly copper and steel)
- the socket (for the gold part)
- for RAM
- the "strip" (and mainly the associated gold) on which the RAM chips are soldered
- the printed circuit surface
- for the SSD
- the wafer substrate
- the contacts and the quantity of gold associated
For the motherboard, in addition to the LCA of the circuit board, the following are taken into account:
- capacitors
- the diodes
- inducers
- resistances
- transistors
For HDD (mechanical), the impact factors are calculated per unit based on an evaluation performed on a 3.5" disk.
Finally, for the rest of the server the elements taken into account are :
- the frame /case
- the optical drive
- the extension card
- the cables
- Li-Ion battery
In summary, here are the impact factors of interest for our case study:
| Component | Unit | ADP (kgSbeq) | GWP (kgCO2eq) | PE (MJ) |
|---|---|---|---|---|
| CPU Base | Unit | 2.04E-02 | 9.14 | 156.00 |
| CPU Die | cm2 | 5.80E-07 | 1.97 | 26.50 |
| RAM Base | Unit | 1.69E-03 | 5.22 | 74.00 |
| RAM Die | cm2 | 6.30E-05 | 2.20 | 27.30 |
| SSD Base | Unit | 5.63E-04 | 6.34 | 76.90 |
| SSD Die | cm2 | 6.30E-05 | 2.20 | 27.30 |
| HDD | Unit | 2.50E-04 | 31.10 | 276.00 |
| Motherboard | Unit | 3.69E-03 | 66.10 | 836.00 |
| Rack Server | Unit | 2.02E-02 | 150.00 | 2 200.00 |
| Blade Enclosure | Unit | 4.32E-01 | 880.00 | 12 700.00 |
| Blade Server | Unit | 6.72E-04 | 30.90 | 435.00 |
| Server Assembly | Unit | 1.41E-06 | 6.68 | 68.60 |
| Power Supply Unit | kg | 8.30E-03 | 24.30 | 352.00 |
Environmental impact factors
What level of confidence can be attributed to this data?
The assessment of data quality in an LCA is often done according to the following criteria:
- temporal representativeness
- geographical representativeness
- technological representativeness
The study on which we have mainly relied is the result of a long-term collaboration between the Okö-Institut and the Fraunhofer, whose collaboration has made it possible to update often outdated data.
In particular, they were able to rely on a model of wafer production based on data published by two of the main suppliers, Siltronic and Sumco (15 and 28% of the market). These data allow a good temporal (2017) and geographical (4 main producing countries) representativeness. Nevertheless, they were not able to differentiate wafer production according to their size (200 or 300 mm).
For the manufacture of components, the collection of data on manufacturing processes was not always possible:
- For CPUs, an update was made using Intel data (80% of the market), including Xeon processor manufacturing. Based on Intel 2017 reports, with a manufacturing process using 300mm wafers and 14nm technology and with an international distribution of production (USA, Israel, Ireland for CPUs and Asia, for the "back end") these data have a good representativeness.
- For RAM and SSD (nand) storage components, recent manufacturer data was not considered reliable enough to be updated and the study relies on data already used in previous studies (Schödwell et al. (2018), Prakash et al. (2013)).
- For these last components, we can therefore consider that the quality of the data is average and it will be important to continue an active watch to reinforce them.
In order to increase these quality levels, we have chosen to separate the impact factors by die area from the "technological" elements associated with the performance of the components:
- die area per core for the CPU,
- storage density per die area for RAM and SSD.
This decoupling allowed us to complete the data from the study with more recent data and thus to improve the technological representativeness.
We will continue this process and publish regular updates.
3.3 Results of this third approach and update of the formula
Based on these last elements, it is now possible to propose a multi-criteria evaluation of the environmental impacts of a server based on its technical characteristics.
Below are the formulas derived from our analysis. These are generic formulas that can be applied to each environmental impact indicator by replacing criteria with the desired indicator (gwp, adp or pe). Let's start by evaluating the impacts by component (the multi-criteria impact factors can be found in the "environmental impact factors" table presented earlier).
For the CPU:
cpumanufcriteria = cpuunits x ( ( cpucoreunits x cpudiesize + 0,491 ) x cpumanuf_diecriteria + cpumanuf_basecriteria )
with:
| Constant | Unit | Value |
|---|---|---|
| cpudiesize | cm2 | 0.245* |
| cpumanuf_diegwp | kgCO2eq/cm2 | 1.97 |
| cpumanuf_dieadp | kgSbeq/cm2 | 5.80E-07 |
| cpumanuf_diepe | MJ/cm2 | 26.50 |
| cpumanuf_basegwp | kgCO2eq | 9.14 |
| cpumanuf_baseadp | kgSbeq | 2.04E-02 |
| cpumanuf_basepe | MJ | 156.00 |
* default value based on the average die area for 14nm architectures
For RAM:
rammanufcriteria = ramunits x ( ( ramsize / ramdensity ) x rammanuf_diecriteria + rammanuf_basecriteria )
with:
| Constant | Unit | Value |
|---|---|---|
| ramdensity | GB/cm2 | 1.79* |
| rammanuf_diegwp | kgCO2eq/cm2 | 2.20 |
| rammanuf_dieadp | kgSbeq/cm2 | 6.30E-05 |
| rammanuf_diepe | MJ/cm2 | 27.30 |
| rammanuf_basegwp | kgCO2eq | 5.22 |
| rammanuf_baseadp | kgSbeq | 1.69E-03 |
| rammanuf_basepe | MJ | 74.00 |
* default value based on the average density for the last generations of each manufacturer
For the SSD:
ssdmanufcriteria = ssdunits x ( ( ssdsize / ssddensity ) x ssdmanuf_diecriteria + ssdmanuf_basecriteria )
with:
| Constant | Unit | Value |
|---|---|---|
| ssddensity | GB/cm2 | 50.6* |
| ssdmanuf_diegwp | kgCO2eq/cm2 | 2.20 |
| ssdmanuf_dieadp | kgSbeq/cm2 | 6.30E-05 |
| ssdmanuf_diepe | MJ/cm2 | 27.30 |
| ssdmanuf_basegwp | kgCO2eq | 6.34 |
| ssdmanuf_baseadp | kgSbeq | 5.63E-04 |
| ssdmanuf_basepe | MJ | 76.90 |
* default value based on the average density for the last generations of each manufacturer
For the HDD:
hddmanufcriteria = hddunits x hddmanuf_unitcriteria
with:
| Constant | Unit | Value |
|---|---|---|
| hddmanuf_unitgwp | kgCO2eq | 31.10 |
| hddmanuf_unitadp | kgSbeq | 2.50E-04 |
| hddmanuf_unitpe | MJ | 276.00 |
For power supply:
psumanufcriteria = psuunits x psuunitweight x psumanuf_weightcriteria
with:
| Constant | Unit | Value |
|---|---|---|
| psumanuf_weightgwp | kgCO2eq/kg | 24.30 |
| psumanuf_weightadp | kgSbeq/kg | 8.30E-03 |
| psumanuf_weightpe | MJ/kg | 352.00 |
For server case:
for a Rack server:
enclosuremanufcriteria = rackmanufcriteria
For a Blade server:
enclosuremanufcriteria = blademanufcriteria + blade_enclosuremanufcriteria / 16
with:
| Constant | Unit | Value |
|---|---|---|
| rackmanufgwp | kgCO2eq | 150 |
| rackmanufadp | kgSbeq | 2.02E-02 |
| rackmanufpe | MJ | 2 200.00 |
| blademanufgwp | kgCO2eq | 30.90 |
| blademanufadp | kgSbeq | 6.72E-04 |
| blademanufpe | MJ | 435.00 |
| blade_enclosuremanufgwp | kgCO2eq | 880.00 |
| blade_enclosuremanufadp | kgSbeq | 4.32E-01 |
| blade_enclosuremanufpe | MJ | 12 700.00 |
For the whole server:
servermanufcriteria = cpumanufcriteria + rammanufcriteria + ssdmanufcriteria+ hddmanufcriteria + motherboardmanufcriteria + psumanufcriteria + enclosuremanufcriteria + assemblymanufcriteria
with:
| Constant | Unit | Value |
|---|---|---|
| motherboardmanufgwp | kgCO2eq | 66.10 |
| motherboardmanufadp | kgSbeq | 3.69E-03 |
| motherboardmanufpe | MJ | 836.00 |
| assemblymanufgwp | kgCO2eq | 6.68 |
| assemblymanufadp | kgSbeq | 1.41E-06 |
| assemblymanufpe | MJ | 68.60 |
Application to our use case:
If we take the example of the Dell R740 with the characteristics of 2 CPUs of 24 cores, 12 bars of 32 GB of RAM and 1 SSD of 400 GB we obtain the following results:
| ADP (kgSbeq) | GWP (kgCO2eq) | EP (MJ) | |
|---|---|---|---|
| CPU | 4.08E-02 | 43.4 | 651 |
| RAM | 3.38E-02 | 534.0 | 6 740 |
| SSD | 1.06E-03 | 23.7 | 293 |
| OTHER | 7.37E-02 | 369.0 | 5 220 |
| TOTAL | 1.49E-01 | 970.0 | 12 900 |
These results (at least for the GWP indicator) are consistent with Dell’s LCA study both on the total impact (about 6% difference) and at the component level:
| Component | ACV DELL - GWP (kgCO2eq) | Boavizta Calculator - GWP (kgCO2eq) |
|---|---|---|
| CPU | 47 | 43 |
| RAM | 533 | 534 |
| SSD | 64 | 24 |
| OTHER | 266 | 369 |
| TOTAL | 910 | 970 |
We can confirm this visually by looking at the distribution of impact by component:

These emission factors also corroborate Sarah Boyd’s findings on the importance of die area as a dimensional element of the environmental impact of key server components.
Taking the same server characteristics, we obtain the following ratios (relative die impact) for the carbon footprint indicator, which is more than 85% of the GWP impact related to the die of the components:
| Component | GWP (kgCO2eq) | % |
|---|---|---|
| CPU Other | 18 | 2.02% |
| CPU Die | 25 | 2.79% |
| RAM Other | 63 | 6.95% |
| RAM Die | 472 | 52.25% |
| SSD Other | 51 | 5.62% |
| SSD Die | 274 | 30.38% |
| TOTAL | 902 | 100.00% |
The other lesson that deserves our attention is the interest of a multi-criteria approach. When we represent the relative importance of the components for each criterion, we can see significant variations:

If we focus on GHG emissions, the importance of RAM is considerable compared to CPU. Especially in the case where the amount of RAM is very large. If we look instead at the abiotic resource depletion (ADP) indicator, the relative impact of the CPU increases significantly when that of RAM decreases.
This example shows that the indicators are not perfectly correlated and that a multi-criteria evaluation is essential to avoid impact transfers.
3.4 Limitations of this third approach
This third approach allowed us to make progress on several aspects:
- A better understanding of the key elements (CPU architecture, storage density) for a more accurate assessment of the environmental impacts of server manufacturing
- Impact factors by component
- A multi-criteria evaluation and confirmation of its importance, particularly for the ADP indicator
However, we must continue to work on some of the limitations we face:
- The absence of other environmental criteria such as water use
- Lack of data on specific components (especially GPUs which are at least as impactful as CPUs)
- A better consideration of the generations of technology
- More education/documentation around the ADP criterion (approaches described in Guinea 2016) to facilitate comparisons with other studies
Conclusion
The Boavizta initiative was founded on the desire to simplify, improve the accuracy and speed up the process of evaluating the environmental impact of digital organizations. Today, our research of data, evaluation methods and successive iterations presented in this article lead us to highlight two observations:
- The digital domain is deeply immature in terms of environmental impact assessment. Very few data exist and those provided by manufacturers are often not transparent, poorly documented and based on a single criterion.
- However, the lines are moving and new research publications - notably by the German Federal Environment Agency - are finally making it possible to obtain the first reliable multi-criteria impact factors.
In addition to these findings, we have also drawn various lessons from this work, the main ones being
- The first practical results are very positive:
- It is possible to perform a multi-criteria assessment of the scope 3 of a server, based on a bottom-up approach, i.e. from the key components.
- The importance of a multi-criteria approach is validated: whether it is to avoid pollution transfers or to integrate the most specific indicator in the digital domain (ADP), we demonstrate that the use of a multi-criteria evaluation seems more than ever indispensable.
- many perspectives:
- To be able to evaluate the impact of server manufacturers and to challenge PCFs, at least on the GWP criterion and on the hardware configurations selected for the evaluation
- Extend the scope of the study to the network, storage systems and data centers in general
- Provide higher level impact factor assessments on typical servers
- Use this data to provide a multi-criteria evaluation of Cloud instances
- Continue a study of the state of the art and validate and reference the most relevant data in an open database
- Provide tools & APIs that allow the community to exploit these data and evaluation methods
- And of course compare these results with those of the NegaOctet project which will certainly complete these first advances!
If you think you can help us extend or refine this study in any way, please contact us.
Bibliography
Manufacturers
Boavizta's dataset
Studies
Sarah B. BOYD, Life-Cycle Assessment of Semiconductors, Springer, New York, 2012.
Udit GUPTA et al., « Chasing Carbon: The Elusive Environmental Footprint of Computing », 2021.
Prakash et al. (2013): Datenbasis IKT S. Prakash, R. Liu, K. Schischke, L. Stobbe. Schaffung einer Datenbasis zur Ermittlung ökologischer Wirkungen der Produkte der Informations- und Kommunikationstechnik (IKT) (UBA TEXTE 82/2013), Umweltbundesamt (Hrsg.) Dessau-Roßlau, 2013.
Prakash et al. (2016): Öko-APC S. Prakash, F. Antony, Dr. A. R. Köhler, R. Liu. Ökologische und ökonomische Aspekte beim Vergleich von Arbeitsplatzcomputern für den Einsatz in Behörden unter Einbeziehung des Nutzerverhaltens (Öko-APC). Umweltbundesamt (Hrsg.) Dessau-Roßlau, 2016.
Schödwell et al. (2018): KPI4DCE B. Schödwell, Prof. Dr. R. Zarnekow, R. Liu, J. Gröger. Kennzahlen und Indikatoren für die Beurteilung der Ressourceneffizienz von Rechenzentren und Prüfung.
Articles
Marie GARCIA BARDON, Bertrand PARVAIS, « The environmental footprint of logic CMOS technologies. A DTCO-based analysis », Imec, 2020.
Nick EVANSON, « Explainer: What Is Chip Binning? Hitting the Silicon Lottery Jackpot », Techspot, 2020.
Jens GRÖGER, Ran LIU, Lutz STOBBE, Jan DRUSHKE, Nikolai RICHTER, « Green Cloud Computing.Lebenszyklusbasierte Datenerhebung zu Umweltwirkungen des Cloud Computing », Umwelt Bundesamt, 2021.
Anton SHILOV, « SK Hynix Details DDR5-6400 », Anandtech, 2019.
Jim HANDY, « 64-Layer 3D NAND Chips Revealed at ISSCC », The Memory Guy, 2017.
Eric MASANET et al., « Recalibrating global data center energy-use estimates », ScienceMag, 2020.
David MYTTON, « Extrapolation of data center energy estimates », David Mytton blog, 2021.
Ralph HINTEMANN, « Data centers 2018. Efficiency gains are not enough: Data center energy consumption continues to rise significantly - Cloud computing boosts growth », ResearchGate, 2020.
Carole-Jean WU, Udit GUPTA, « Most of computing’s carbon emissions are coming from manufacturing and infrastructure », Facebook tech article, 2021.